News
Read about the progress we’re making across the mortgage and real estate services industry.
05/09/2022
U.S. Home Prices Slowed from Record Appreciation in First Quarter, Radian Home Price Index Reveals
This press release features multimedia. View the full release here: https://www.businesswire.com/news/home/20220509005899/en/
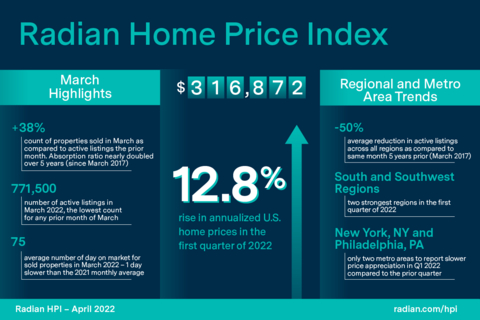
Radian Home Price Index (HPI) Infographic (Graphic: Business Wire)
The Radian HPI also rose 15.3 percent year-over-year (
“The first quarter saw a pullback from the record pace of home price appreciation witnessed in recent quarters. The current measure is still significantly higher than prior years, but new headwinds to affordability and supply are negatively impacting both the ability and willingness to purchase a home. And, while the refinance market is more sensitive to mortgage rate movements, there is little question that higher mortgage payments have started to impact homebuyer confidence as well,” noted
NATIONAL DATA AND TRENDS
-
Median home price in the
U.S. rose to$316,872 in March - Home prices rose an annualized 12.7 percent during March
After slowing in appreciation rates in each of the prior five months, home price appreciation increased in March at a faster rate of 12.7 percent on an annualized basis, an acceleration of home price appreciation above the 11.8 percent annualized increase in the prior month. Nationally, the median estimated price for single-family and condominium homes rose to
Supply remains very constrained for both distressed and non-distressed properties. While most federal and state foreclosure moratoriums have been lifted, the number of distressed property listings remains near historic lows. This month the count of distressed (REO, short sale) listings represented just 4.3 percent of all listings, just slightly above the all-time low of 4.0 percent recorded a few months earlier. Strong homeowner equity growth over the last few years has pushed down loan-to-value ratios across the country, providing a non-distressed sale option even to those homeowners that can no longer afford their current property.
In general, the volume of active listings of properties for sale continues to remain at historically low levels In March, the
REGIONAL DATA AND TRENDS
- First quarter 2021 results are positive for all Regions
- Supply is 50+% lower on average, than five year ago, across all regions
Last month, three regions – the South, Southwest and West – reported faster appreciation rates than the prior month. In the first three months of 2021, all six regional indices recorded positive home price appreciation rates. Compared to the fourth quarter of 2021, all but one region recorded slower home price appreciation. The South region actually posted a faster annualized rate of appreciation in the first quarter of this year than the last quarter of 2021. Strong sales continue to support these positive appreciation rates. Nationally, the first quarter of 2022 recorded just under 730,000 total closed sales, slightly below the 750,000 record set in the first quarter of 2021, and still was the second-strongest Q1 on record.
Likely impacted by seasonal declines in activity, home prices in the Northeast recorded the slowest rate of appreciation in the first quarter of the year. The South and Southwest were the strongest regions in the first quarter, with the South reporting an annualized first quarter appreciation rate of 21 percent. When evaluated by price points, during the quarter, homes at all price points recorded positive appreciation.
Similar to national numbers, listing activity region-by-region remains far below historic norms. Using the same five-year lookback, the index of regional listing volumes for all but one of our regions stands 40% to 55% lower than
METROPOLITAN AREA DATA AND TRENDS
- Metro areas end quarter on strong note
- All 20 largest Core-Based Statistical Areas (CBSAs) accelerated in the last month
Metropolitan areas did quite well in the most recent quarter. All but two of the 20 largest metro areas (
Not surprisingly, Days on Market (DOM) fell for listed properties in the
ABOUT THE RADIAN HPI
Red Bell, a subsidiary of
The company offers subscription access to the entire Radian HPI data set and the Radian HPI Portal for content visualization and data extraction. The engine behind the Radian HPI has created more than 100,000 unique data series, which are updated on a monthly basis.
The Radian HPI Portal is a self-service data and visualization platform that contains a library of high-value indices based on both geographic dimensions as well as by market, or property attributes. The platform provides monthly updated access to nine different geographic dimensions, from the national level down to zip codes. In addition, the Radian HPI provides unique insights into market changes, conditions and strength across multiple property attributes, including bedroom count and livable square footage. To help enhance its customers’ understanding of granular real estate markets, the library is expanded regularly to include more insightful indices.
In addition to the services offered by its Red Bell subsidiary, Radian is ensuring the American dream of homeownership responsibly and sustainably through products and services that include industry-leading mortgage insurance and a comprehensive suite of mortgage, risk, title, valuation, asset management and other real estate services. The company is powered by technology, informed by data and driven to deliver new and better ways to transact and manage risk. Visit www.radian.com to see how Radian is shaping the future of mortgage and real estate services.
View source version on businesswire.com: https://www.businesswire.com/news/home/20220509005899/en/
For Investors
Email: john.damian@radian.com
For the Media
Email: rashi.iyer@radian.com
Source: