News
Read about the progress we’re making across the mortgage and real estate services industry.
01/20/2021
2020 U.S. Home Prices: A Bright Spot in a Dark Year
This press release features multimedia. View the full release here: https://www.businesswire.com/news/home/20210120005671/en/
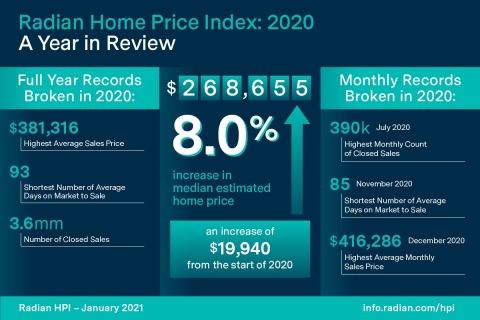
Radian Home Price Index: 2020 - A Year in Review (Graphic: Business Wire)
For the full year, the Radian HPI rose 8.0 percent year-over-year (
For the calendar year, national real estate records were broken in several important statistical categories.
National records broken in 2020:
- Highest Average Sales Price $381,316
- Shortest Days on Market to Sale 93
- Number of Closed Sales 3.6mm
- Average Active Monthly Listings 1.2mm
“In the end, there was nothing typical about 2020,” noted
“The confluence of fiscal policy, monetary policy, the administration, and private sector innovation such as remote valuations, digital closings and many other product innovations, paved the way to not just stabilize housing, but to create an environment for strong growth,” added Gaenzler.
NATIONAL DATA AND TRENDS
-
Median home price in the
U.S. rose to$268,655 - Home prices rose an annualized 9.3 percent over the final quarter
The national median estimated price for single-family and condominium homes rose to
Across the
REGIONAL DATA AND TRENDS
- States set records in all transactional categories tracked
- From year earlier, Midwest maintains strongest Region
Regionally, five of our six regions had stronger home price appreciation in 2020 than they did in 2019. The MidAtlantic region, which includes
The breadth of market strength in real estate was stunning this past year. Similar to our national reporting, states broke records in nearly all transactional categories.
State Records in 2020:
- Highest Number of Closed Sales 37 states
- Highest Average Sales Price 47 states
- Highest Average Listing Price 46 states
- Shortest Days on Market to Sale 31 states
Pace of home price appreciation differs by state; however all 50 states recorded positive home price appreciation in 2020. In fact, 44 states recorded faster appreciation in 2020 compared to 2019. In 2020, in the ten most populous states, all of them captured home price growth faster in 2020 than 2019 and the average increase was above the national average.
METROPOLITAN AREA DATA AND TRENDS
- Largest metropolitan areas grew in 2020
- 2020 is on pace to be one of the most active on record
Across the 20-largest metro areas of the
Throughout 2020 much dialogue was spent on trying to determine whether homeowners were moving out of larger cities to improve their standard or quality of living. The Radian HPI data indicates that smaller cities outperformed mega-cities in 2020. Of a group of 50 cities that represent large and small communities, and include the most important regional and mega-cities, the average city HPI rose more than 7.5 percent in 2020. The top half of these cities grew an average rate of 10.5 percent and included only three of the top 25 largest (mega) cities in the
ABOUT THE RADIAN HPI
Additional content on the housing market can also be found on the Radian Insights page located at https://radian.com/news-and-knowledge/insights.
Red Bell offers the Radian HPI data set along with a client access portal for content visualization and data extraction. The engine behind the Radian HPI has created more than 100,000 unique data series, which are updated on a monthly basis.
The Radian HPI Portal is a self-service data and visualization platform that contains a library of thousands of high-value indices based on both geographic dimensions as well as by market, or property attributes. The platform provides monthly updated access to nine different geographic dimensions, from the national level down to zip codes. In addition, the Radian HPI provides unique insights into market changes, conditions and strength across multiple property attributes, including bedroom count and livable square footage. To help enhance customers’ understanding of granular real estate markets, the library is expanded regularly to include more insightful indices.
In addition to the services offered by its Red Bell subsidiary, Radian is ensuring the American dream of homeownership responsibly and sustainably through products and services that include industry-leading mortgage insurance and a comprehensive suite of mortgage, risk, title, valuation, asset management and other real estate services. The company is powered by technology, informed by data and driven to deliver new and better ways to transact and manage risk. Visit www.radian.com to see how Radian is shaping the future of mortgage and real estate services.
View source version on businesswire.com: https://www.businesswire.com/news/home/20210120005671/en/
For Investors
Email: john.damian@radian.com
For the Media
Email: rashi.iyer@radian.com
Source: